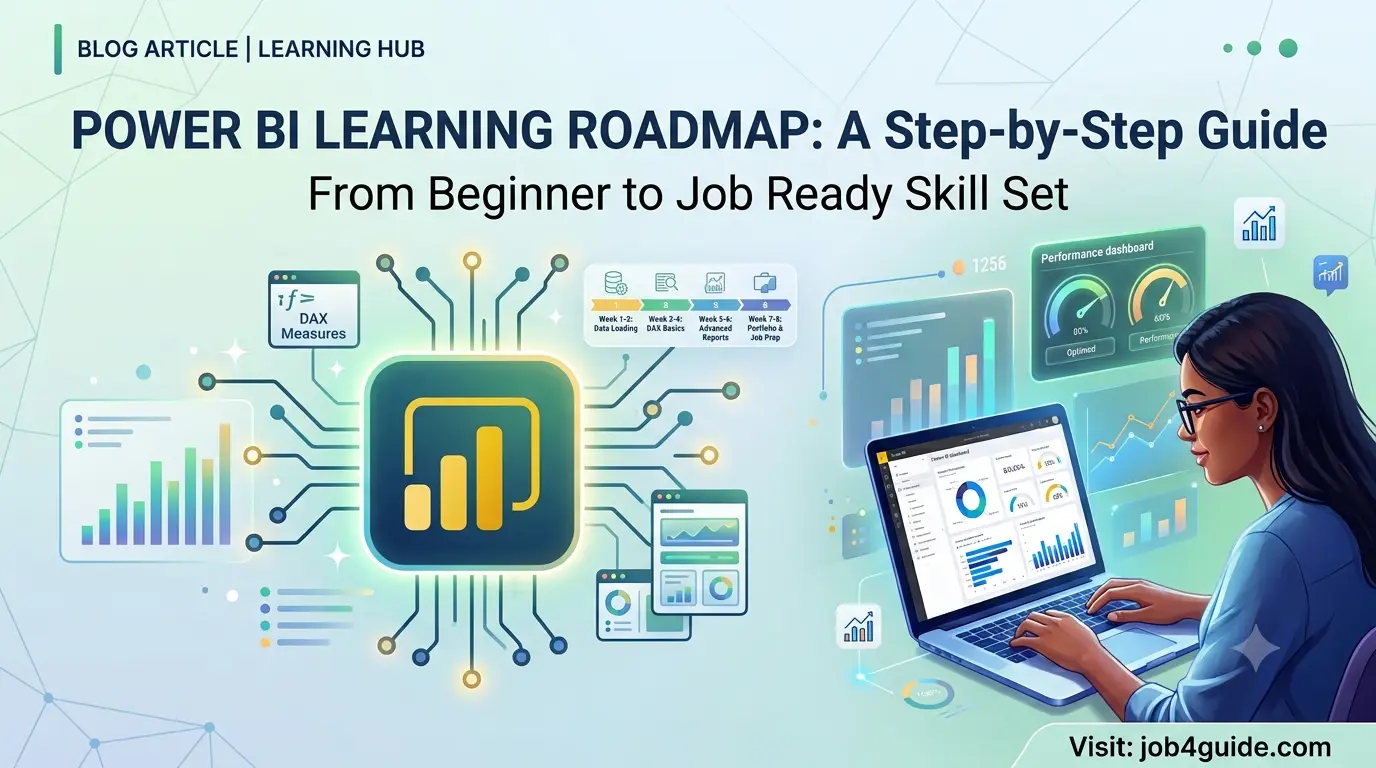
Learn Power BI the right way. Below is a simple, week-by-week roadmap that takes you from zero knowledge to a job-ready Power BI skill set.
If you have ever opened a messy Excel sheet and wished it could turn into a clean, easy-to-read dashboard in a few clicks, Power BI is the tool for you. Companies today collect huge amounts of data, but data alone does not help anyone. Someone has to turn that data into charts and reports that a manager can understand in ten seconds. That is exactly the job Power BI does, and that is why so many companies are hiring people who know this tool.
This guide gives you a clear, step-by-step path to learn Power BI from scratch. You do not need a coding background or a data science degree. You just need a computer, some free time, and the willingness to practice. By the end of this roadmap, you will know what to learn, in what order, and how long each stage usually takes.
What Is Power BI?
Power BI is a tool made by Microsoft. It helps you connect to data (like Excel files, databases, or websites), clean that data, and turn it into charts, graphs, and dashboards. Think of it as Excel’s smarter cousin, one that is built for reporting and analysis on a much bigger scale.
It has three main parts you will use often:
- Power BI Desktop – the free app on your computer where you build reports.
- Power Query – the part that cleans and shapes your data.
- Power BI Service – the website where you publish and share reports with others.
The Complete Power BI Roadmap at a Glance
Here is the full roadmap in one picture. Each box is one stage of learning, and the arrows show the order you should follow.
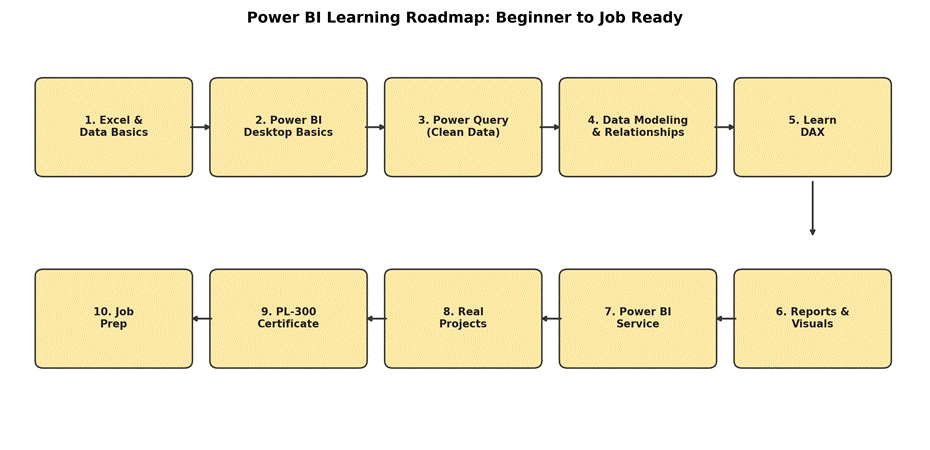
Figure 1: Power BI learning roadmap from beginner to job ready
Step-by-Step Learning Path
Step 1: Learn Basic Excel and Data Concepts
Before you touch Power BI, spend a few days getting comfortable with basic Excel work: sorting data, using filters, writing simple formulas like SUM and IF, and understanding what rows, columns, and tables mean. You should also understand simple data ideas such as what a ‘record’ is and what a ‘field’ is. This base makes everything in Power BI easier to understand, because Power BI is built on the same idea of rows and columns, just at a much larger scale.
Step 2: Install Power BI Desktop and Learn the Interface
Download Power BI Desktop for free from Microsoft’s website. Spend your first week just clicking around. Learn where the Fields pane is, where the Visualizations pane is, and how the three views (Report, Data, and Model) are different. Do not worry about making anything fancy yet. The goal here is comfort, not skill.
Step 3: Learn Power Query (Cleaning Your Data)
Real-world data is messy. It has blank cells, wrong spellings, extra spaces, and columns you do not need. Power Query is the tool inside Power BI that fixes all of this before the data reaches your report. Learn how to remove columns, split columns, change data types, merge tables, and fix errors. This step is often skipped by beginners, but it is one of the most useful skills you can have, since most real jobs involve messy data.
Step 4: Learn Data Modeling and Relationships
Once your data is clean, you need to connect your tables the right way. This is called data modeling. You will learn about primary keys, foreign keys, and how to build relationships between tables so that your report calculates numbers correctly. A wrong relationship is one of the most common reasons a Power BI report shows wrong numbers, so take your time here.
Step 5: Learn DAX (Data Analysis Expressions)
DAX is the formula language of Power BI. It looks a little like Excel formulas but works differently because it deals with whole tables and columns, not single cells. Start with simple formulas like SUM, AVERAGE, and COUNT, then slowly move to CALCULATE, which is the most important DAX function of all. Give this stage extra time, because DAX is usually the hardest part of Power BI for most learners.
Step 6: Learn Data Visualization and Report Design
Now the fun part begins. Learn how to choose the right chart for the right data, how to use slicers and filters, and how to design a report that looks clean and is easy to read. A good report does not use twenty colors and ten chart types on one page. Keep it simple, keep it clear, and always design with the reader in mind, not just yourself.
Step 7: Learn Power BI Service (Publishing and Sharing)
Once your report is ready, you need to share it with others. Power BI Service is the website where you publish your reports, set up scheduled data refresh, create dashboards, and manage who can see what. Learn how workspaces work and how to share a report link with a teammate. This is a skill many beginners forget to practice, but it matters a lot in real jobs.
Step 8: Work on Real Projects
Reading and watching tutorials is not enough. Pick two or three real datasets, for example sales data, HR data, or sports data, and build full reports from scratch, from cleaning to final dashboard. Put these projects on a free portfolio website or on LinkedIn. Recruiters trust projects far more than certificates alone, because projects prove you can actually do the work.
Step 9: Get Certified (PL-300)
The official Microsoft certification for Power BI is called PL-300: Power BI Data Analyst. It is not required to get a job, but it does two things well: it gives your resume extra weight, and it forces you to study topics you might otherwise skip. Plan for about two to three weeks of focused revision before the exam.
Step 10: Prepare for Jobs
Update your resume to highlight your Power BI projects, not just the tool name. Practice explaining your projects out loud, since interviewers often ask you to walk through a report you built. Also practice common interview questions about DAX, data modeling, and how you would fix a slow report. Apply to Data Analyst, BI Analyst, and Reporting Analyst roles, since these are the titles that use Power BI most often.
How Long Does It Take to Learn Power BI?
This depends on how many hours a week you can give it, but here is a realistic timeline for someone studying a few hours a week alongside a job or college.
| Stage | What You Learn | Time Needed | Difficulty |
| 1 | Excel & data basics | 1 week | Easy |
| 2 | Power BI Desktop interface | 1 week | Easy |
| 3 | Power Query (data cleaning) | 2 weeks | Medium |
| 4 | Data modeling & relationships | 2 weeks | Medium |
| 5 | DAX formulas | 3 weeks | Hard |
| 6 | Visuals & report design | 2 weeks | Medium |
| 7 | Power BI Service | 1 week | Easy |
| 8 | Real projects | 3 weeks | Medium |
| 9 | PL-300 certificate prep | 2 weeks | Medium |
Add these up and most learners become job-ready in about four to five months of steady, part-time study. If you can study full-time, you can cut this down to about six to eight weeks.
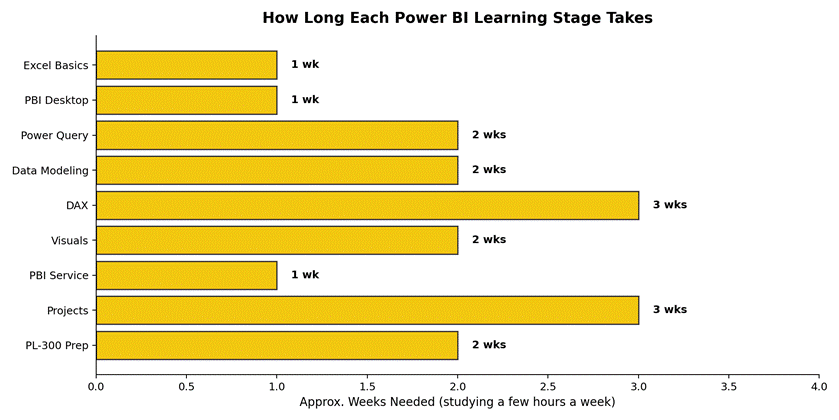
Figure 2: Approximate weeks needed for each learning stage
Free Resources to Learn Power BI
You do not need to pay for expensive courses to start. Here are resources that are free and cover almost everything a beginner needs:
- Microsoft Learn – official, free, and beginner-friendly lessons on every Power BI topic.
- YouTube channels dedicated to Power BI – great for watching someone build a report step by step.
- Sample datasets from Kaggle – use these to practice on real, messy data.
- Power BI community forums – ask questions and see how others solve similar problems.
- Microsoft’s own sample reports – open them and study how they are built.
Common Mistakes Beginners Make
Knowing what to avoid can save you weeks of confusion. Here are mistakes seen most often:
- Skipping Power Query and jumping straight to charts. This leads to messy reports later.
- Learning DAX by memorizing formulas instead of understanding how it thinks about tables.
- Building reports with too many colors, fonts, and chart types on one page.
- Never publishing a report to Power BI Service, so real sharing skills stay untested.
- Not building any personal project, which makes it hard to answer interview questions.
- Ignoring data modeling and connecting tables the wrong way, which causes wrong numbers.
Frequently Asked Questions
Is Power BI hard to learn?
No, not if you go step by step. The interface part is easy. DAX and data modeling take more practice, but with steady effort, most people become comfortable within a few months.
Do I need coding skills to learn Power BI?
No coding is required for most Power BI work. DAX is a formula language, not a programming language, so it is much easier to pick up than languages like Python or SQL. That said, knowing basic SQL is a helpful extra skill, not a requirement.
Is Power BI free?
Power BI Desktop, the app where you build reports, is completely free. Sharing reports with a team through Power BI Service usually needs a paid license, but you can learn and practice everything for free on your own computer.
How long does it take to get a job using Power BI?
Most learners who study a few hours a week and build real projects are ready to apply for jobs in about four to six months. Having two or three strong projects matters more than the total study time.
Is the PL-300 certificate worth it?
It is useful but not compulsory. It helps your resume stand out and proves your knowledge to employers, but real projects and interview performance usually matter more to hiring managers.
What jobs can I get after learning Power BI?
Common job titles include Data Analyst, BI Analyst, Reporting Analyst, and Business Analyst. Many finance, marketing, and operations roles also now expect basic Power BI knowledge, even if the job title does not mention it directly.
Final Thoughts
Power BI is one of the most practical tools you can learn right now. It does not require a technical background, it has a gentle learning curve if you follow the right order, and it opens the door to many data-related jobs. Follow this roadmap one stage at a time, build real projects along the way, and avoid the mistakes listed above. Consistency matters far more than speed, so keep practicing a little every week, and job-ready skills will follow naturally.