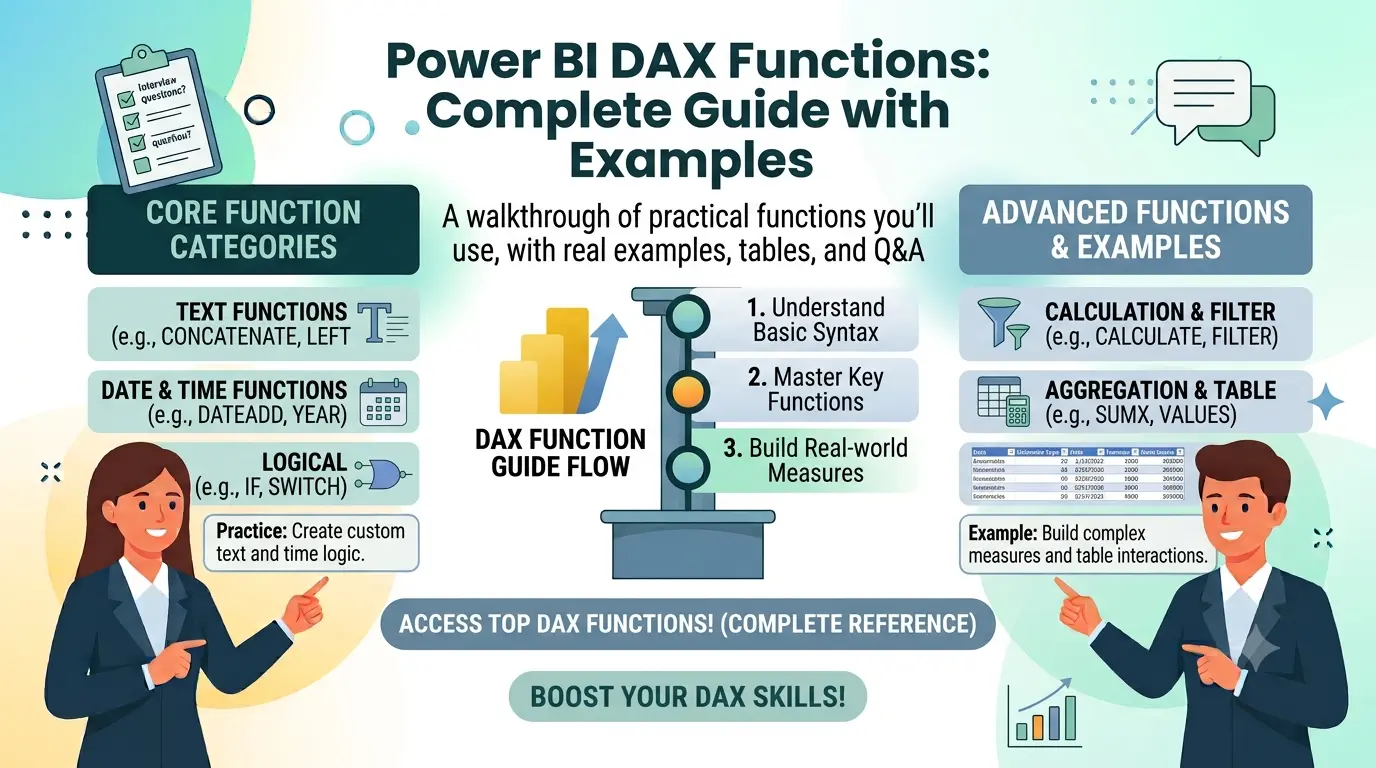
A walkthrough of the DAX functions you will actually use in Power BI, with real examples, tables, and answers to common questions.
If you open Power BI and try to build your first measure, you will run into DAX sooner or later. DAX stands for Data Analysis Expressions. It is the formula language Power BI uses to do calculations. At first, DAX can feel a bit strange, even if you already know Excel formulas. But once you understand a few core ideas, most DAX functions start to make sense.
This guide walks through the most useful DAX functions in Power BI. We keep the language simple and use short, real examples so you can copy them straight into your own reports. By the end, you should be able to write your own measures with confidence, not just copy formulas you don’t fully understand.
What Is DAX in Power BI?
DAX is a collection of functions, operators, and constants that you use to build formulas in Power BI, Power Pivot, and SQL Server Analysis Services (SSAS) tabular models. You use DAX to create two main things:
- Calculated columns — new columns added to a table, worked out row by row and stored in the model.
- Measures — calculations that run on the fly, based on whatever is being viewed in a report, such as a table, chart, or slicer.
Most of the time, you will use DAX to build measures, because measures react to filters and slicers. That is what makes a Power BI report feel interactive instead of static.
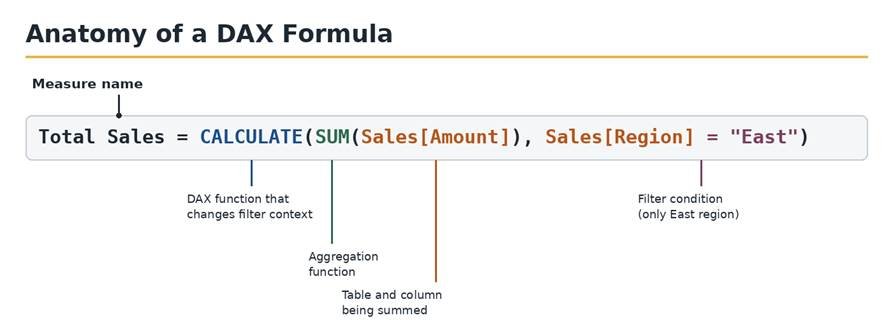
Figure 1: The parts of a simple DAX measure.
DAX Function Categories
Power BI has more than 250 DAX functions, but you do not need to learn them all. Most real-world reports use functions from just a handful of categories. Here is a quick map before we look at examples.
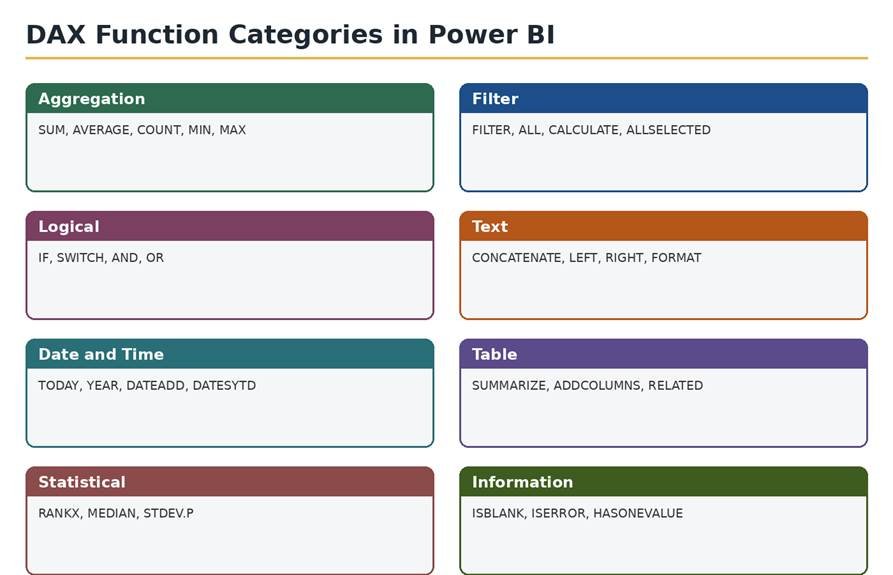
Figure 2: The main groups of DAX functions in Power BI.
| Category | What it does | Common functions |
| Aggregation | Adds up, averages, or counts values across rows. | SUM, AVERAGE, COUNT, MIN, MAX |
| Filter | Changes which rows are visible before a calculation runs. | FILTER, ALL, CALCULATE, ALLSELECTED |
| Logical | Tests a condition and returns different results. | IF, SWITCH, AND, OR |
| Text | Builds, joins, or reshapes text values. | CONCATENATE, LEFT, RIGHT, FORMAT |
| Date and time | Works with calendars, years, and rolling periods. | TODAY, YEAR, DATEADD, DATESYTD |
| Table | Creates or reshapes whole tables inside a formula. | SUMMARIZE, ADDCOLUMNS, RELATED |
| Statistical | Ranks, ranges, and other statistics. | RANKX, MEDIAN, STDEV.P |
| Information | Checks the type or state of a value. | ISBLANK, ISERROR, HASONEVALUE |
Most Used DAX Functions With Examples
Below are the DAX functions people search for most, grouped by what they do. Each one includes a short example you can adapt for your own tables. In every example, replace the table and column names with the ones from your own data.
1. SUM — Add Up a Column
SUM adds together every value in a column. It is usually the first DAX function people learn.
Total Sales = SUM(Sales[Amount])
This measure adds up every row in the Amount column of the Sales table. Whatever filters are applied in the report, such as a specific month or region, SUM only adds up the rows that are still visible after the filter.
2. SUMX — Add Up a Custom Calculation
SUMX is like SUM, but it lets you calculate something first, row by row, before adding it up. This is useful when the number you need is not already stored as a column.
Total Revenue = SUMX(Sales, Sales[Quantity] * Sales[Unit Price])
Here, Power BI multiplies Quantity by Unit Price for every row, then adds all of those results together. Any function ending in X, such as SUMX, AVERAGEX, or MINX, works this way: it loops through rows, then finishes with a calculation.
3. CALCULATE — Change the Filter Context
CALCULATE is the most important function in DAX. It lets you take a calculation and apply new filters to it, or remove filters that already exist. Many advanced DAX formulas are really just CALCULATE with different filters inside.
East Sales = CALCULATE(SUM(Sales[Amount]), Sales[Region] = “East”)
This measure always shows sales for the East region, even if someone filters the report by a different region. CALCULATE overrides the outside filter with the one written inside the formula.
4. IF — Simple Conditions
IF checks whether something is true or false, then returns one result or another. It works the same way as IF in Excel.
Sales Status = IF(SUM(Sales[Amount]) > 10000, “Good”, “Needs Review”)
If total sales are above 10,000, the measure shows Good. Otherwise, it shows Needs Review.
5. SWITCH — Multiple Conditions
SWITCH is what you use once you have more than two or three outcomes to check. It reads more clearly than nesting several IF statements inside each other.
Sales Grade =
SWITCH(
TRUE(),
SUM(Sales[Amount]) > 50000, “A”,
SUM(Sales[Amount]) > 20000, “B”,
SUM(Sales[Amount]) > 5000, “C”,
“D”
)
Power BI checks each condition in order, from top to bottom, and stops at the first one that is true.
6. FILTER — Build a Filtered Table
FILTER returns a smaller table that only has the rows matching a condition. On its own, FILTER does not show numbers, so it is normally used inside another function such as CALCULATE or SUMX.
High Value Sales =
CALCULATE(
SUM(Sales[Amount]),
FILTER(Sales, Sales[Amount] > 1000)
)
This measure adds up only the rows where a single sale was worth more than 1,000.
7. RELATED — Pull a Value From Another Table
RELATED brings in a value from a related table, as long as the two tables are joined by a relationship in your data model. It is often used inside calculated columns.
Product Category = RELATED(Products[Category])
If your Sales table is linked to a Products table, this calculated column pulls the category of each product straight into the Sales table.
8. ALL — Remove Filters
ALL removes filters from a table or column. It is often used to calculate a total that ignores whatever the user has selected, such as a grand total or a percentage of the whole.
Percent of Total Sales =
DIVIDE(
SUM(Sales[Amount]),
CALCULATE(SUM(Sales[Amount]), ALL(Sales))
)
The top part of this formula reacts to filters as normal. The bottom part uses ALL to always look at every row, no matter what is selected. Dividing one by the other gives a percentage of the grand total.
9. DIVIDE — Safe Division
DIVIDE works like a normal division, but it handles the case where you divide by zero. Instead of showing an error, you can tell it what to show instead.
Profit Margin = DIVIDE(SUM(Sales[Profit]), SUM(Sales[Amount]), 0)
If total sales are zero, this measure shows 0 instead of an error message. Using DIVIDE instead of the forward slash symbol is considered good practice in DAX.
10. Date Functions — TODAY, YEAR, DATEADD, DATESYTD
Date functions are used for anything time-based, such as year-over-year comparisons, running totals, or showing figures for a specific period.
Current Year Sales = CALCULATE(SUM(Sales[Amount]), YEAR(Sales[Date]) = YEAR(TODAY()))
Sales Last Year = CALCULATE(SUM(Sales[Amount]), DATEADD(Sales[Date], -1, YEAR))
Sales Year to Date = TOTALYTD(SUM(Sales[Amount]), Sales[Date])
These three examples show sales for the current year, sales from the same period last year, and a running year-to-date total. For date functions like these to work properly, your model needs a proper date table marked as a date table in Power BI.
11. COUNTROWS — Count Rows in a Table
COUNTROWS counts how many rows are in a table, after any filters are applied. It is often used to count things like the number of orders or the number of active customers.
Number of Orders = COUNTROWS(Sales)
Other Frequently Used DAX Functions
The table below covers a few more functions that are worth knowing, along with a plain description of what each one does.
| Function | What it does | Simple example |
| AVERAGE | Finds the average of a column. | AVERAGE(Sales[Amount]) |
| DISTINCTCOUNT | Counts unique values in a column. | DISTINCTCOUNT(Sales[CustomerID]) |
| RANKX | Ranks a value against other rows. | RANKX(ALL(Products), SUM(Sales[Amount])) |
| CONCATENATE | Joins two pieces of text together. | CONCATENATE(Customer[First], Customer[Last]) |
| ISBLANK | Checks if a value is empty. | ISBLANK(Sales[Discount]) |
| VAR | Stores a value to reuse in a formula. | VAR TotalSales = SUM(Sales[Amount]) |
Common DAX Mistakes to Avoid
Most DAX errors come from a small set of habits. Here are the ones that trip up beginners most often.
- Dividing without DIVIDE. A plain slash symbol will throw an error when the bottom number is zero. Use the DIVIDE function instead so you can control what shows up.
- Confusing calculated columns with measures. Calculated columns are worked out once and stored in the table. Measures are worked out on the fly, based on the current filters. Using the wrong one can slow down your report or give you the wrong numbers.
- Forgetting a proper date table. Time intelligence functions like DATEADD, TOTALYTD, and SAMEPERIODLASTYEAR need a real date table marked as a date table, or the results can be wrong.
- Nesting too many IF statements. Once you have more than two or three conditions, SWITCH is easier to read and easier to fix later.
- Not testing filter context. A measure can give different answers depending on whether it’s placed in a table, a card, or a chart with slicers applied. Always check a measure in more than one visual before trusting it.
Tips for Writing Better DAX
- Start simple. Write the basic version of a measure first, get it working, then add complexity like CALCULATE or FILTER on top.
- Use variables (VAR). Storing a value with VAR makes long formulas easier to read and can also make them run faster, since the value is only calculated once.
- Name measures clearly. A measure called Total Sales YTD is easier to reuse than one called Measure 3.
- Check your results. Compare a new measure against a simple pivot table or a manual calculation to make sure the numbers make sense.
- Learn filter context first. Almost every confusing DAX bug comes down to not knowing what is being filtered at that point in the formula. This single idea unlocks most of DAX.
Frequently Asked Questions
What does DAX stand for in Power BI?
DAX stands for Data Analysis Expressions. It is the formula language used in Power BI, Power Pivot, and Analysis Services tabular models to build measures and calculated columns.
Is DAX hard to learn?
DAX is not hard to start using, but it takes practice to fully understand filter context, which is the idea that a formula’s result depends on the filters applied around it. Most people can write simple measures within a day and get comfortable with CALCULATE and time intelligence within a few weeks of regular use.
What is the difference between a measure and a calculated column?
A calculated column is worked out once, row by row, and saved inside the table. A measure is worked out only when you use it in a visual, and it changes based on filters, slicers, and what is on the report page. In most cases, measures are the better choice for totals and calculations you want to see in charts.
What is the most important DAX function to learn first?
CALCULATE. Once you understand how CALCULATE changes filter context, most of the other advanced functions, including time intelligence functions like DATEADD and TOTALYTD, become much easier to understand, since many of them are built using CALCULATE behind the scenes.
Can I use DAX in Excel, or only in Power BI?
DAX is not only for Power BI. It is also used in Excel through Power Pivot, and in SQL Server Analysis Services tabular models. The functions and rules are almost identical across all three tools.
Why does my DAX measure show the wrong number?
This is almost always a filter context problem. Check what filters, slicers, or visual fields are affecting the measure. It can help to test the same measure in a simple table visual with no other fields, then add filters back one at a time until you see where the number changes.
Final Thoughts
DAX looks intimidating at first, mostly because of the syntax and the sheer number of functions. But in practice, a small set of functions such as SUM, CALCULATE, IF, FILTER, and a few date functions will cover most of what you need to build a working Power BI report. Start with the basics in this guide, practice on your own data, and add new functions only when you actually need them. That approach will get you writing solid DAX formulas much faster than trying to memorize the whole list at once.