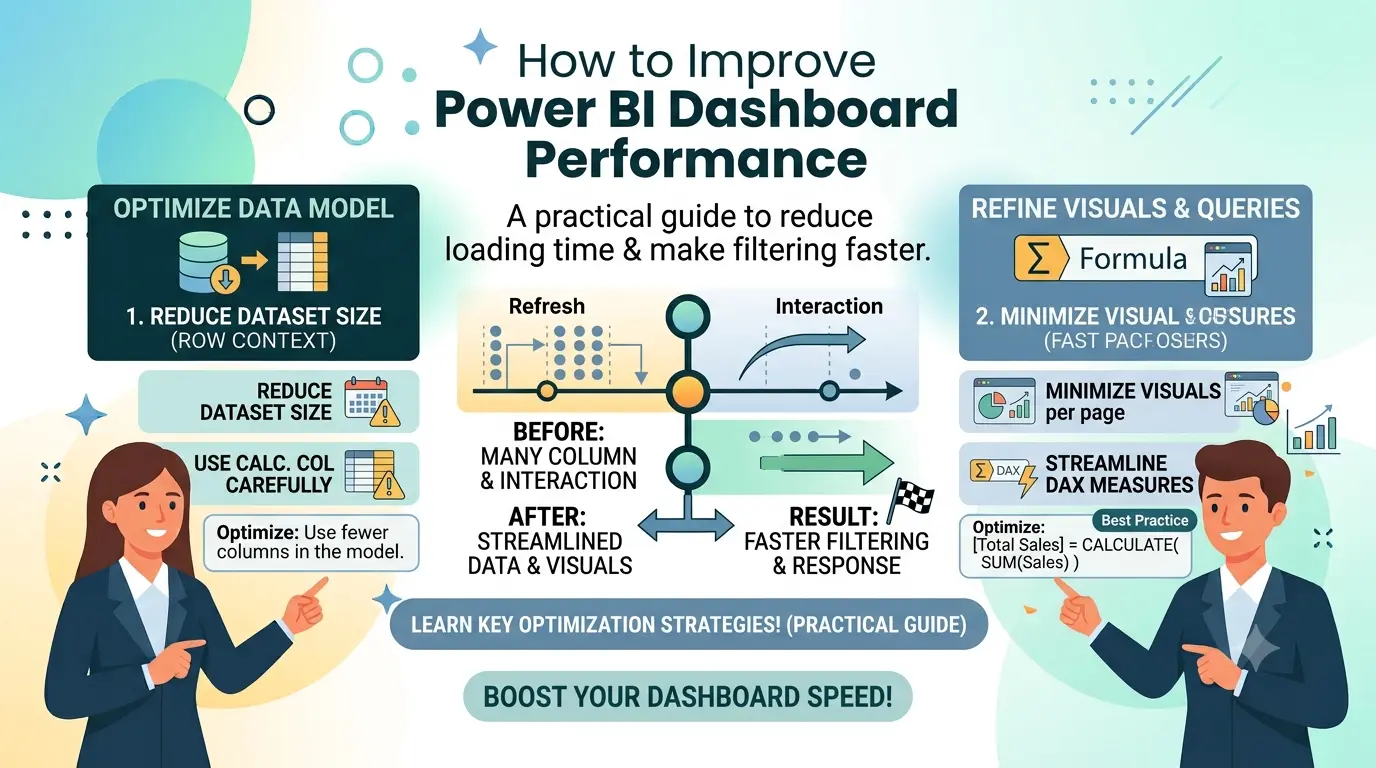
A simple, practical guide for anyone whose Power BI reports feel slow to open, click, or filter.
If you have ever clicked open a Power BI report and then watched a spinning circle for ten or twenty seconds, you already know how frustrating a slow dashboard can be. A report that takes too long to load does not just waste time. It also makes people trust the data less and use the report less. The good news is that most slow Power BI reports can be fixed. In this article, we will go through the main reasons reports load slowly, and simple steps you can take to make them faster.
This guide is written for report builders, analysts, and business users who are not necessarily database experts. We will keep the language simple and focus on practical steps you can try today.
Why Does a Power BI Report Load Slowly?
Before fixing the problem, it helps to know what usually causes it. In most cases, slow performance comes from one or more of these issues:
- Too much data being loaded, including columns and rows nobody actually uses
- A data model that is not built the right way (for example, one big flat table instead of a clean star schema)
- Heavy DAX formulas that Power BI has to recalculate every time you click something
- Too many visuals on one page, all trying to load and refresh at once
- Using DirectQuery mode when Import mode would work better
- Slow data sources, slow network, or slow refresh steps in Power Query
- Custom visuals or images that are large in file size
Once you know the cause, fixing it is usually a matter of following a checklist. Let’s go through the fixes one by one.
Step 1: Find Out What Is Actually Slow
Do not guess. Power BI has a free built-in tool called Performance Analyzer that shows you exactly which visual, which query, and which step is taking the most time.
How to Use Performance Analyzer
- Open your report in Power BI Desktop.
- Go to the View tab and turn on Performance Analyzer.
- Click Start Recording, then click Refresh Visuals.
- Look at the list. It shows the time each visual took to load, split into three parts: DAX query time, visual display time, and other time.
- Sort the list from slowest to fastest, and start fixing the top items first.
This one step alone saves a lot of guesswork. Instead of trying random fixes, you can see the exact visual or measure that is slowing everything down.
Step 2: Choose the Right Storage Mode
Power BI can connect to data in a few different ways. The two most common are Import mode and DirectQuery mode. Picking the right one has a big effect on speed.
| Storage Mode | How It Works | Best For |
| Import | Data is copied into Power BI’s own fast engine (VertiPaq) | Most reports. Fastest option in almost all cases. |
| DirectQuery | Power BI sends a live query to the source every time you click | Very large or real-time data that cannot be imported |
| Composite Model | Mixes Import and DirectQuery tables in one model | Large fact tables with small, fast lookup tables |
As a simple rule: use Import mode whenever you can. It is almost always faster because the data lives inside Power BI’s own high-speed engine instead of waiting on a live database connection for every click.
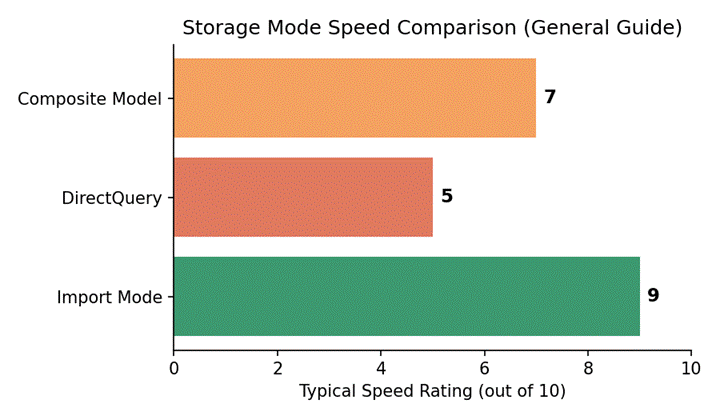
Figure 1: General speed comparison of Power BI storage modes
Step 3: Clean Up Your Data Model
A messy data model is one of the biggest hidden causes of slow reports. Here is how to clean it up.
Only Load the Data You Need
- Remove columns you are not using. Every extra column adds size and slows things down, even if it is never shown on a visual.
- Filter out rows you do not need, such as old data outside your reporting period.
- Turn off Auto Date/Time in Power BI settings if you are not using it, since it silently creates hidden date tables for every date column.
Use a Star Schema
A star schema means you have one central fact table (like Sales) connected to smaller lookup tables (like Customer, Product, Date). This is much faster than one giant flat table with everything mixed together, because Power BI’s engine is built to work well with this shape.
Fix Data Types and Relationships
- Use whole numbers or dates instead of text where possible. Text columns are slower to filter and sort.
- Avoid bi-directional relationships unless you truly need them, since they can create extra work behind the scenes.
- Set relationships correctly so Power BI does not have to guess how tables connect.
Step 4: Write Faster DAX Measures
DAX is the formula language behind Power BI’s calculations. Some DAX patterns are naturally slow, while others do the same job much faster.
- Use variables (VAR) inside your measures. This stops Power BI from calculating the same thing twice.
- Avoid using calculated columns when a measure will do the same job. Measures are calculated only when needed, not stored in the model.
- Stay away from row-by-row functions like FILTER on large tables when a simpler function will work.
- Avoid using IF statements inside measures where a simple filter or SWITCH would be cleaner and faster.
Step 5: Simplify the Report Page
Even a well-built data model can feel slow if the report page itself is overloaded.
- Limit the number of visuals per page. As a rough guide, keep it under 8 to 10 visuals on a single page.
- Turn off cross-highlighting or filtering for visuals that do not need to interact with each other.
- Use slicers carefully. Each slicer adds a small load every time it changes.
- Avoid very high-detail visuals like tables with thousands of rows on the main dashboard page. Send users to a detail page instead.
- Compress or resize background images before adding them to a report.
Step 6: Speed Up Data Refresh with Power Query
Power Query is where your data is cleaned and shaped before it reaches the report. If this part is slow, your refresh will be slow too.
- Use query folding whenever possible. This means Power Query sends the cleaning steps back to the source database instead of doing them inside Power BI.
- Remove unused queries and unused steps.
- Combine steps where you can instead of adding many small ones.
- For very large tables, set up Incremental Refresh so Power BI only refreshes new or changed data instead of the whole table every time.
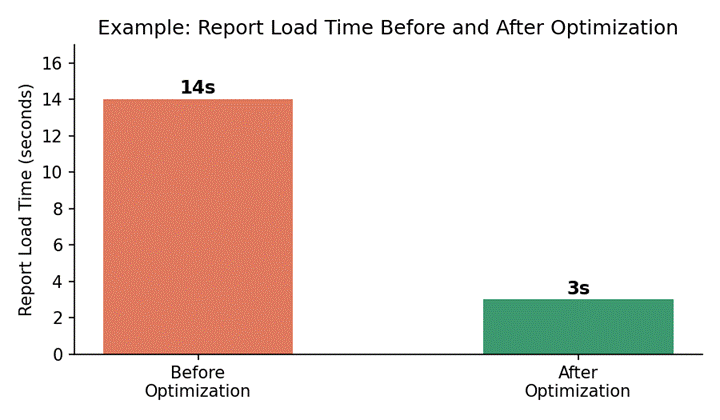
Figure 2: Example of load time improvement after applying these steps (results vary by report)
Quick Checklist: Dos and Don’ts
| Do This | Avoid This |
| Use Import mode when possible | Using DirectQuery for small or medium data |
| Remove unused columns and rows | Loading every column just in case |
| Build a star schema | Using one giant flat table |
| Use variables in DAX measures | Repeating the same calculation many times |
| Keep 8–10 visuals per page | Cramming 20+ visuals on one page |
| Use Incremental Refresh for large tables | Refreshing the full table every time |
Frequently Asked Questions
Why is my Power BI report so slow to open?
The most common reasons are too much data being imported, a messy data model, heavy DAX measures, or too many visuals on one page. Start with Performance Analyzer to find the exact cause before making changes.
Does DirectQuery make reports slower?
Usually yes, compared to Import mode, because every click sends a new query to the source system. DirectQuery is only worth using when the data is too large to import or needs to be live and up to the second.
How many visuals should one Power BI page have?
There is no fixed rule, but a good target is around 8 to 10 visuals per page. If a page needs more than that, consider splitting it into two pages or using drill-through pages for detail.
What is query folding and why does it matter?
Query folding is when Power Query pushes your cleaning and filtering steps back to the original database, so the database does the heavy work instead of Power BI. This can make refreshes many times faster, especially on large tables.
Can too many slicers slow down a report?
Yes. Each slicer adds extra filtering work every time it changes, especially if it is connected to many visuals. Keep the number of slicers reasonable and disable interactions that are not needed.
Is a calculated column or a measure better for performance?
In most cases, a measure is better because it is only calculated when needed and is not stored inside the data model. Calculated columns take up extra space and are calculated during data refresh, which can slow things down if overused.
Final Thoughts
Making a Power BI dashboard faster is rarely about one big fix. It is usually a series of small, sensible choices: loading only the data you need, building a clean model, writing efficient DAX, and keeping report pages simple. Start with Performance Analyzer to see where the real problem is, fix the biggest issues first, and test again after each change. Over time, these small steps add up to a dashboard that opens quickly and keeps your users happy.