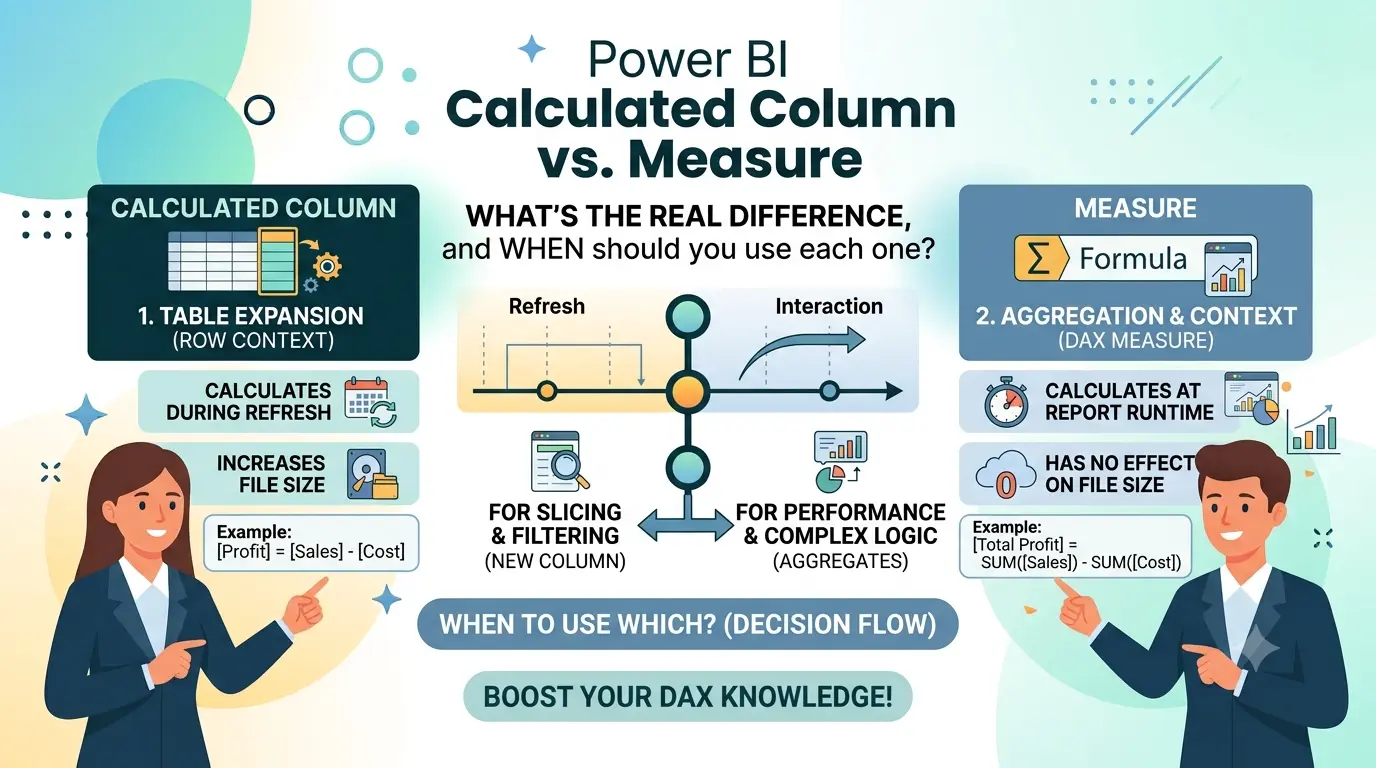
What’s the real difference, and when should you use each one?
If you have spent any time building reports in Power BI, you have probably typed “New Column” and “New Measure” without stopping to think about what makes them different. They both use DAX. They both show numbers. But they do not work the same way, and picking the wrong one can slow down your report or give you the wrong answer.
In this guide, we will break down calculated columns and measures in plain, simple words, with real examples you can copy into your own file. No jargon, no confusing theory, just clear explanations and working DAX code.
The Short Answer
Calculated column: A new piece of data added to a table, calculated once for every row, and saved inside the table itself.
Measure: A calculation that runs only when you drop it into a visual, and it recalculates every time a filter changes.
Think of a calculated column as something you write down on paper once. A measure is more like a calculator that gives you a fresh answer every time you press a different button.
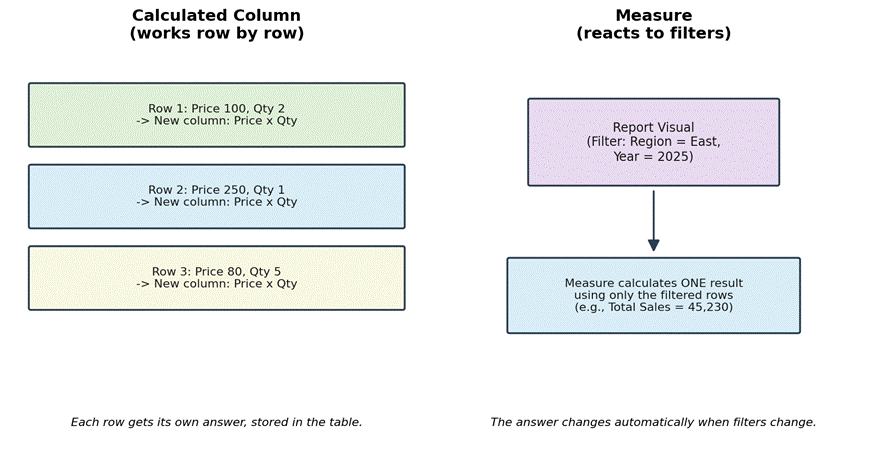
Figure 1: Calculated columns work row by row. Measures react to whatever filters are applied in the report.
What Is a Calculated Column?
A calculated column is a new column you add to a table using a DAX formula. Power BI goes through the table row by row and works out the value for each row, one at a time. Once it is done, the result is stored inside your data model, just like a normal column that came from your source file.
Example 1: Total Value Column
Say you have a sales table with a Price column and a Quantity column. You want a new column that shows the total value for each row.
Total Value = ‘Sales'[Price] * ‘Sales'[Quantity]
This formula runs once for every row. Row 1 gets its own answer, row 2 gets its own answer, and so on. Here is what the result looks like:
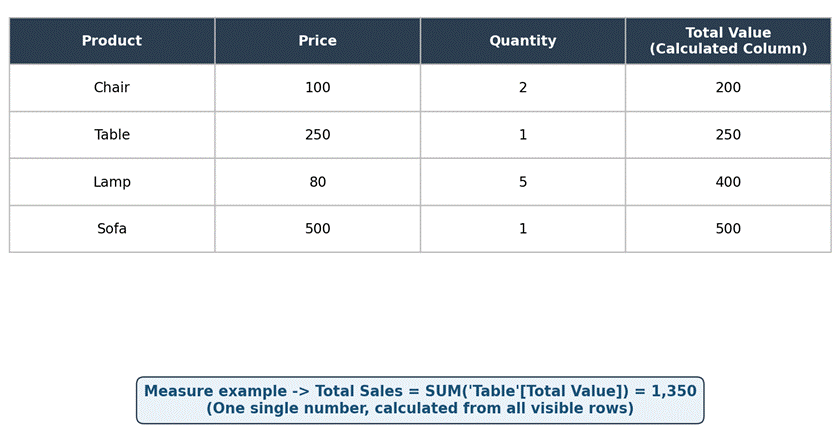
Figure 2: Each row calculates its own Total Value. This is a classic calculated column example.
Example 2: Full Name Column
Calculated columns are not just for numbers. You can also join text together. Say you have a First Name and Last Name column, and you want one combined Full Name column for your visuals.
Full Name = ‘Employees'[First Name] & ” ” & ‘Employees'[Last Name]
This is a common trick when you need a single column to use as a filter, a slicer, or a label on a chart axis.
Example 3: Category Label Using IF
You can also use logic inside a calculated column. Here is one that labels each sale as “High Value” or “Normal” based on the amount.
Sale Type =
IF(‘Sales'[Total Value] > 300, “High Value”, “Normal”)
This new column can now be used as a slicer or put on the rows of a table, because it behaves exactly like a column that came from your database.
What Is a Measure?
A measure is also written in DAX, but it does not get stored row by row. Instead, it sits quietly in your data model doing nothing until you place it in a visual, a card, or a table. At that point, it looks at whatever filters are active — the slicers, the page filters, the rows and columns in a matrix — and calculates a single result based on that filtered data.
Example 1: Total Sales
Using the same Total Value column from before, a simple measure to add everything up looks like this:
Total Sales = SUM(‘Sales'[Total Value])
If you put this measure on a card with no filters, it adds up every row. If you then click a slicer for “East Region”, the same measure instantly recalculates and only adds up the East Region rows. You did not write two formulas. One measure, many answers, depending on context.
Example 2: Average Order Value
Average Order Value = AVERAGE(‘Sales'[Total Value])
Drop this on a chart broken down by month, and Power BI works out the average separately for each month, using only that month’s rows.
Example 3: Percentage of Total
This is where measures really shine, because a calculated column simply cannot do this well. Say you want to know what percentage each product contributes to total sales.
% of Total Sales =
DIVIDE(
[Total Sales],
CALCULATE([Total Sales], ALL(‘Sales’))
)
Here, CALCULATE and ALL temporarily ignore the filters so the measure can compare “this row’s sales” against “all sales combined”. Because a calculated column is locked in at the row level, it cannot reach out and grab the grand total the way a measure can.
Example 4: Year-over-Year Growth
Time comparisons are another job that belongs to measures, not calculated columns, because the answer depends on which dates are currently in view.
Sales Last Year =
CALCULATE([Total Sales], SAMEPERIODLASTYEAR(‘Date'[Date]))
YoY Growth % =
DIVIDE([Total Sales] – [Sales Last Year], [Sales Last Year])
Calculated Column vs Measure: Key Differences
Here is a side-by-side comparison to make the differences easy to remember.
| Point | Calculated Column | Measure |
| When it calculates | Once, when data is loaded or refreshed | Every time, based on the current filter |
| Where the result lives | Stored inside the table, takes up memory | Not stored, calculated on the fly |
| Context it uses | Row context (one row at a time) | Filter context (whatever is applied) |
| Can be used as a filter or slicer | Yes | No |
| Can be placed on rows/columns of a table | Yes | No, only as values |
| File size impact | Increases file size | Almost no impact on file size |
| Best for | Text labels, grouping, static row-level logic | Totals, averages, ratios, time comparisons |
When Should You Use Each One?
Use a Calculated Column When…
- You need a new field to filter, slice, or group by (like a category or a full name).
- The value only depends on other columns in the same row.
- You want the result to appear on the rows or columns of a table or matrix, not just as a number.
- You are creating a text label or a flag, such as “Yes / No” or “High / Low”.
Use a Measure When…
- You need a total, average, count, or any kind of summary.
- The answer should change automatically when someone clicks a slicer or filter.
- You are comparing values, like percentage of total or growth versus last year.
- You care about keeping your file size small and your report fast.
Why This Matters for Performance
Calculated columns are calculated once, but they are then stored permanently in your data model. If your table has five million rows, a calculated column adds a value to all five million rows, and that data has to be saved and loaded into memory every time the report opens. This can make your file larger and slower.
Measures do not have this problem. They calculate on demand, using the fast in-memory engine that Power BI is built on, so they usually run quickly even on large tables. As a general rule, if a calculation can be written as a measure instead of a calculated column, it is usually the better choice for performance.
Common Mistakes to Avoid
- Using a calculated column for a total. If you write a calculated column like Sales * Quantity and then try to sum it visually, it works, but a measure would have done the same job without bloating your table.
- Trying to use a measure as a slicer. Measures cannot be dragged into the Filters pane in the same way regular columns can, because they need a row context to exist.
- Forgetting that a calculated column cannot see outside its own row. If your formula needs to compare a row against the total or against another row, you need CALCULATE and a measure, not a plain column.
- Adding too many calculated columns. Every extra calculated column adds to your file size. Before adding one, ask yourself if a measure could do the same job.
Frequently Asked Questions
Can a calculated column use a measure inside it?
No. A calculated column cannot reference a measure, because measures depend on filter context, and a calculated column only has row context. You will get an error if you try.
Can a measure use a calculated column?
Yes. Measures can freely use calculated columns, along with SUM, AVERAGE, COUNT, and other DAX functions, as long as the column already exists in the model.
Which one is faster, a calculated column or a measure?
For simple totals and summaries, measures are usually faster and lighter on memory, because they do not need to be stored row by row. Calculated columns can slow down refresh and increase file size on very large tables.
Do calculated columns update automatically when data changes?
They update when the data model is refreshed, not instantly. Measures always show the latest calculated result the moment you interact with a report, because they calculate live.
Should beginners learn calculated columns or measures first?
Start with calculated columns since they are easier to understand, because they behave like a normal spreadsheet formula. Once you are comfortable, move to measures, since most real report logic in Power BI is built using measures.
Final Thoughts
The easiest way to remember the difference is this: a calculated column adds new data to your table, one row at a time, and stores it. A measure adds new logic to your report, and calculates fresh results based on whatever the user is looking at.
Most of your day-to-day work in Power BI, like totals, percentages, and comparisons, should be done with measures. Save calculated columns for the times you genuinely need a new field to filter, group, or label your data. Once this clicks, DAX starts to feel a lot less confusing.